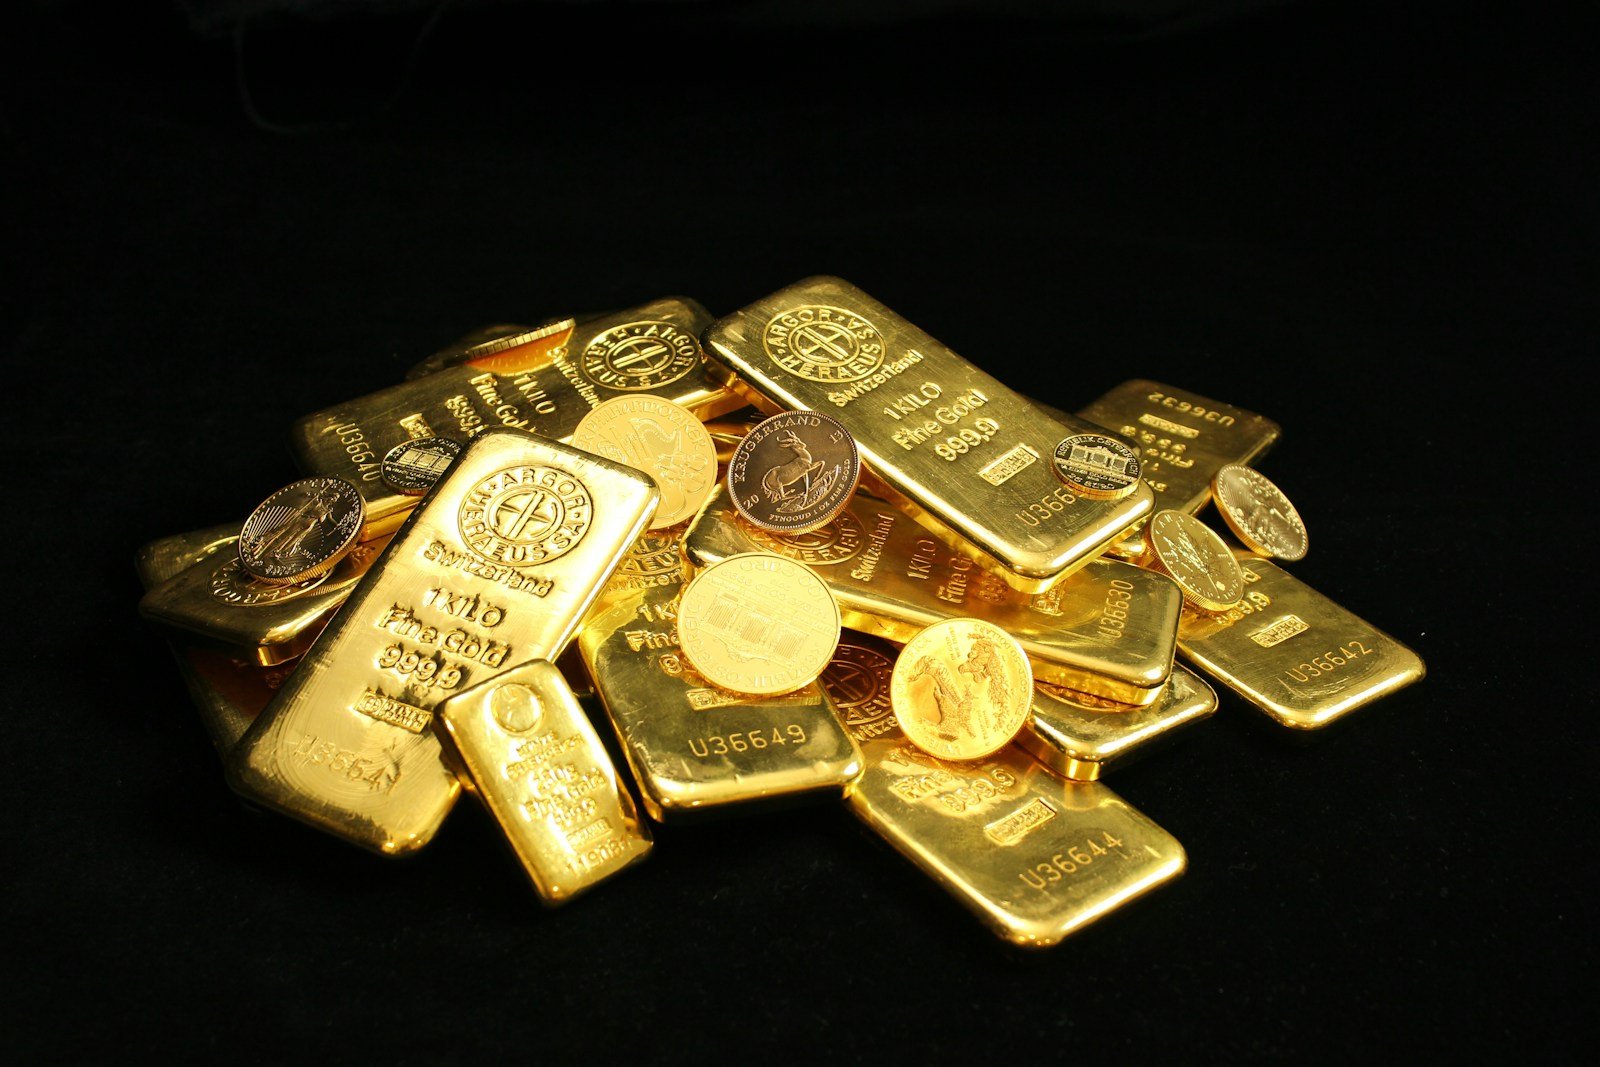
Gold shows up in almost every big financial conversation. When investors are nervous, they talk about gold. When central banks want to lean less on the dollar, they talk about gold. When interest rates rise, gold gets blamed for falling. In 2026 all three conversations are happening at once.
That makes it a good year to ask a bigger question: how much does gold actually move the global market, and how much does the market move gold? The honest answer is that it runs both ways. Gold is a mirror of global anxiety, but it is also a real force through central-bank reserves, investment flows, and the industries built around it.
A Year of Extremes
To understand gold’s impact today, start with how wild the last two years have been. Gold crossed $4,000 an ounce for the first time in October 2025, and it roughly doubled between early 2024 and early 2026. Then came a late-January blow-off. Spot gold hit a record of about $5,595 on January 29.
The reversal was brutal. In March, gold fell more than 10%, its worst month since June 2013. By late June it slipped below $4,000 for the first time since November 2025, more than 28% below its peak. Analysts pointed to a hawkish Fed, a strong dollar, ETF outflows, and a rotation into stocks driven by the AI boom.
A partial recovery followed. By late August, spot gold was hovering around $4,590 to $4,610 as rate-hike expectations cooled. After the Fed actually raised rates on September 16, gold traded around $4,310.
Even after that drop, gold sits far above where it traded a few years ago. The 1980 peak of $850 is worth roughly $3,200 to $3,325 in today’s money, and gold has now cleared that inflation-adjusted record decisively. So while the recent pullback feels dramatic, gold is still trading at historically high levels.
The Seesaw: Interest Rates and the Dollar
Gold pays no interest, so its appeal depends heavily on what you could earn elsewhere. When rates and bond yields rise, holding gold costs more in forgone income. When the dollar strengthens, gold becomes pricier for buyers using other currencies.
Both forces have been working against gold this year. In June the dollar hit its strongest level in more than 13 months, and one analyst described the Fed’s hawkish shift as the dominant driver of gold’s weakness. On September 16 the Fed raised its rate to 3.75%–4.00%, and 16 of 18 officials expect another hike this year. Gold fell and the dollar firmed slightly. Some economists now say the Fed may not cut again until 2028.
Bond yields add pressure. Kitco noted that gold faces a rising-yield threat as the US 10-year Treasury approaches 5%, though it added that demand from investors worried about currency debasement is providing support.
This is the first way gold affects the wider market: it works as a scoreboard for how investors judge central-bank credibility. When markets doubt that the Fed can control inflation, gold tends to benefit. When the Fed convinces markets it is serious, gold usually gives ground.
The Quiet Giant: Central Banks
If the Fed decides gold’s short-term mood, central banks decide its long-term backbone. They bought more than 1,000 tonnes in each of 2022, 2023, and 2024, then another 863 tonnes in 2025, the fourth-largest annual total on record.
2026 has been choppier. Sales by Turkey, Russia, and Azerbaijan dragged first-quarter official demand down to just 57 tonnes. Then buying rebounded to 289 tonnes in the second quarter, up 62% from a year earlier and the highest second-quarter figure on record. Poland and China led the purchases. First-half buying of 345 tonnes was still the lowest since 2022.
Some sales, the World Gold Council notes, are tactical, linked to liquidity needs or currency management. That matters in a year of energy shocks and financial strain. Even so, 45% of central banks surveyed said they plan to add to their gold reserves over the next 12 months. The council expects them to stay significant buyers, though at a slightly slower pace than in the last four years.
This is why central banks matter so much. Their buying is far less sensitive to price than private investment, which means they can put a floor under the market when speculators flee. It also carries a message about the global financial system. JPMorgan has noted that foreign holders of US assets have been gradually redirecting small allocations into bullion as part of a diversification strategy. No one is abandoning the dollar, but gold is quietly taking a bigger share of the world’s reserve mix.
Investors: ETFs, Asian Demand, and the AI Rotation
Private investors are the other big force, and 2026 has shown how fickle they can be. According to the World Gold Council’s second-quarter report, total demand was flat at 1,269 tonnes. First-half demand rose 2% to about 2,522 tonnes, worth roughly $380 billion.
The composition tells the story. Gold-backed ETFs saw 45 tonnes of outflows in the second quarter, though first-half flows stayed slightly positive. Bar and coin demand was 21% higher than a year earlier in the first half. Over-the-counter demand, helped by Asian investors, reached 571 tonnes in the first half.
Going forward, the council expects Western ETF interest to track real yields, US monetary policy expectations, and the dollar. Asian and over-the-counter buying should become more prominent. Put simply, the marginal buyer of gold is shifting from Wall Street toward Asia.
Gold also competes with stocks for capital. When the AI boom pulls money into equities, gold can lose ground, which is part of what happened in June. Analysts described that pressure as cyclical rather than structural, meaning it should not erase the longer-term case. It does show how closely gold’s fortunes are tied to the mood in the tech-heavy stock market.
Beyond Gold: Silver, Copper, and the Metals Complex
Gold’s run also lifted the wider metals market. Silver hit roughly $121.62 an ounce in January, driven by supply deficits and demand from solar panels and AI data centers. Copper set a record near $6.71 a pound in May as data-center electricity demand collided with the first global supply deficit since 2009.
These moves show where gold’s influence ends. Precious metals often rally together on fear and monetary worries. Industrial metals like copper follow a different logic, tied more to technology and construction than to central banks. Silver sits in between, part safe haven and part industrial input. When gold sneezes, the whole complex catches a cold, but each metal has its own story.
Gold, War, and the Inflation Puzzle
Conventional wisdom says war is good for gold. In 2026 that rule has been tested. The World Gold Council’s return-attribution model identifies the US-Iran conflict as the main driver of gold’s first-half performance, and the January spike to about $5,590 came amid war fears.
But things turned more complicated as the conflict dragged on. Fighting pushed oil higher, and higher oil raised inflation and the odds of Fed rate hikes. On one day in July, gold fell 3% as US-Iran clashes lifted oil and rate-hike expectations at the same time.
The lesson is that gold does not respond to fear alone. It responds to how fear feeds into interest rates. With US inflation running at 3.4% in August and central banks in tightening mode, the yield disadvantage of gold has mattered more than its safe-haven appeal. If rate expectations were to reverse, whether because growth weakens or inflation cools, the fear premium could come back quickly.
The Real Economy: Jewelry, Mining, and Everyday Buyers
Gold’s price does more than move trading screens. It changes what people actually buy. Jewelry demand fell 17% from a year earlier in the second quarter, as consumers bought less gold and shifted toward lighter pieces. Yet the value of jewelry demand rose 22% in the first half to $86 billion. People are buying less gold, but paying far more for it.
Late last year, gold discounts in India widened as record prices curbed wedding-season demand, and Chinese dealers offered their steepest markdowns since 2020. Because these two countries dominate jewelry demand, price-sensitive buying there can slow the market even when investment demand is strong.
The World Gold Council also sees little sign of increased recycling, meaning households appear to be holding their gold rather than cashing in. That behavior supports prices, because scrap supply is not flooding the market.
For producers, current prices mean very healthy margins, and for gold-holding countries, larger reserve values. For ordinary families in gold-loving cultures, it means the traditional savings tool has become harder to afford.
Where Could Gold Go From Here?
The forecasts disagree, which says something about how uncertain the moment is.
The World Gold Council places the floor for underlying demand below $3,700 an ounce, against a consensus level near $4,100. It said a move above $4,500 would need a strong global economic slowdown. JPMorgan said in July that demand from key sectors looked weaker than it had expected and limited its path to $4,300 in the third quarter and $4,500 in the fourth. Goldman Sachs took the opposite side, holding to a $5,400 year-end target even after the March slump. That call was made in the spring, and it now looks ambitious next to a price near $4,300.
None of these forecasts should be treated as gospel. Gold has surprised on both sides this year, plunging when the bulls were confident and soaring when the bears were sure.
What to Watch Next
- The Fed’s path. With more hikes on the table, the next US inflation report, due October 14, could move gold sharply.
- Treasury yields. A sustained 10-year yield near or above 5% would keep pressure on non-yielding assets.
- The dollar. A durable breakout higher would weigh on gold even if other supports hold.
- Central-bank buying. The next quarterly data will show whether official demand keeps its rebound.
- Oil and the Middle East. Escalation and de-escalation both move gold, sometimes in surprising directions.
- Asian demand. As Western ETFs become more rate-sensitive, Asian buyers matter more.
The Bottom Line
Gold’s impact on the global market comes down to three roles. It is a thermometer, reading how nervous investors are about inflation, currencies, and central banks. It is a reserve asset, quietly reshaping how governments hold their wealth. And it is a real-world commodity, changing how billions of people save, celebrate, and spend.
In 2026 those roles have pulled in different directions. Fear and central-bank buying pushed gold to a record near $5,600, and rising rates and a stronger dollar took it back toward $4,300. Neither force has gone away. That is why gold, even when it falls, remains one of the most closely watched prices on the planet.
This article is for general information only and isn’t financial advice. Investors should consult a qualified adviser before making decisions.
Figures are current as of September 20, 2026, and gold moves daily, so update the price levels before you publish. I can also trim this to an exact 2,000 words, put it in a file, or tune the tone for your audience.